08.18.10
Posted in Weather News at 4:11 pm by Rebekah
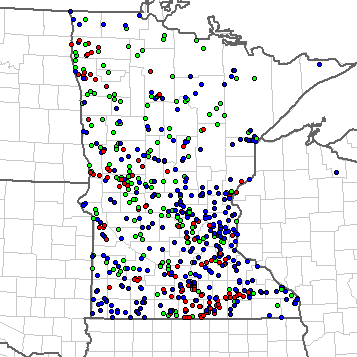
Minnesota has reported 123 tornadoes so far this year, more than any other state.
Texas comes in second, with 87 reported tornadoes.
Annual Severe Weather Report Summary – 2010, Minnesota. Red dots are tornado reports, green hail, wind blue. Courtesy of the SPC.
The most tornadoes in a year in recorded history in Minnesota was 74 in 2001. Not all of these 123 reports will be confirmed as tornadoes; generally the official tornado count is somewhat less than the number of reports, due to multiple reporting of the same tornado or mistakenly reporting a suspicious-looking cloud as a tornado. However, once the National Weather Service completes damage surveys and releases the official numbers next year, 2010 is likely going to break the record for most number of tornadoes in a year in Minnesota (in recorded history).
It is interesting to note that most of these tornadoes came on just a handful of outbreak days, most notably including June 17th (40+). June 17th also broke the record for the most tornadoes in a day in Minnesota history. The previous record was 27 tornadoes on June 16, 1992. Currently, 27 tornadoes have been confirmed with another 15+ likely to be confirmed at a later date. (See NWS Twin Cities report on the event for more.)
One of the reasons for increased tornado reports is the increased number of chasers and spotters observing storms. Also, the storm season didn’t really get going in the Southern Plains until mid- to late April; and by June, the storms had mostly shifted to the Northern Plains (and the season’s still going up there!).
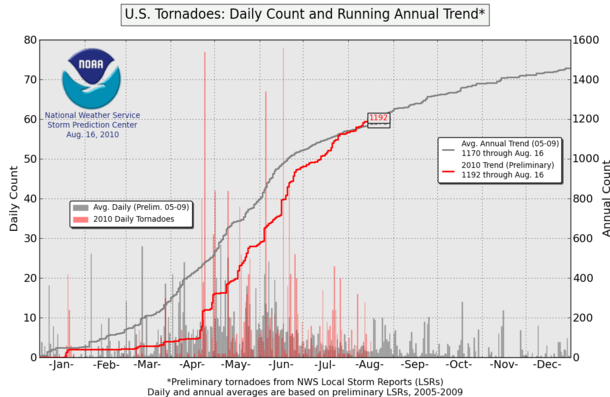
In other news, the U.S. is finally back near the 5-year average for the number of tornado reports.
The following plot shows the 2010 running count for tornado reports (remember, the actual number of tornadoes will be less) as compared to the 5-year average annual trend (gray line). The plot also shows the 2010 count and the average count for every day (outbreak days are pretty obvious).
U.S. Tornadoes: Daily Count and Running Annual Trend. Courtesy of the SPC.
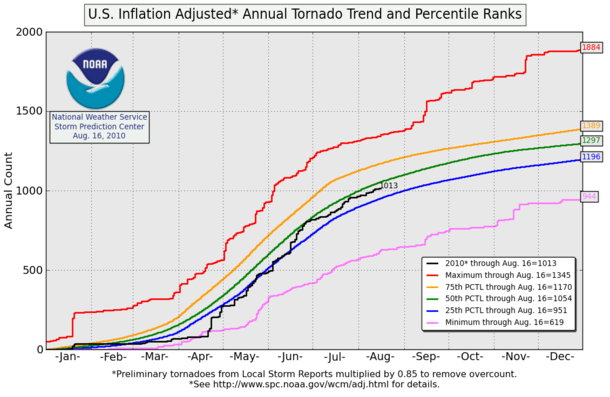
See also the annual tornado trend and percentile ranks as well (below). This plot has been adjusted to account for the overcount of tornadoes (hence “inflation adjusted”). As you can see, we are near the 50th percentile so far (i.e., near average, as the above plot showed too).
U.S. Inflation Adjusted Annual Tornado Trend and Percentile Ranks. Courtesy of the SPC.
Compare these plots with the plots I posted on the blog earlier this year:
April 14: Where Have All The Tornadoes Gone? – (and to think that I was concerned about the lack of tornadoes and chasing opportunities in mid-April…)
May 22: Tornado Season So Far…
For more tornado stats by state and to see what the top 10 active tornado days have been in the U.S. this year, see the SPC’s Annual Weather Report Summary.
Permalink
08.17.10
Posted in Non-US Weather, Weather News at 2:21 pm by Rebekah
This week’s post in the global weather and climate series features Suva, Fiji.
-
-
-
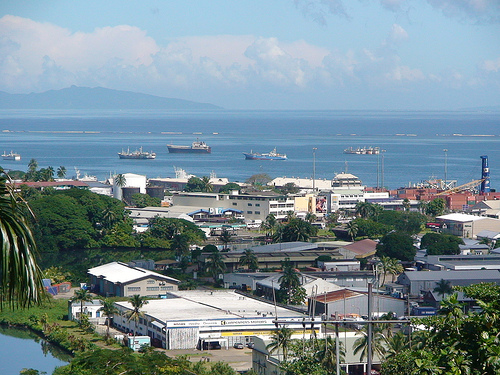
Walu Bay Industrial Zone, Suva City, Fiji. Courtesy of Wikipedia.
Last week we took a look at the weather and climate on the Galápagos Islands, in the east central Pacific Ocean. Today we’ll contrast that with the weather and climate of Fiji, in the south west Pacific Ocean.
The Republic of the Fiji Islands are an archipelago of over 332 islands and over 500 islets, amounting to over 7000 mi² of land. Fiji’s population is 849,000, but 87% of the people live on the two largest islands, Viti Levu and Vanua Levu. Fiji is located about 1200 miles northeast of New Zealand’s North Island. The islands are mountainous, with peaks over 4000 feet. Dependent on tourism and sugar exports, Fiji is also a producer of timber, fish, gold, copper, and oil.
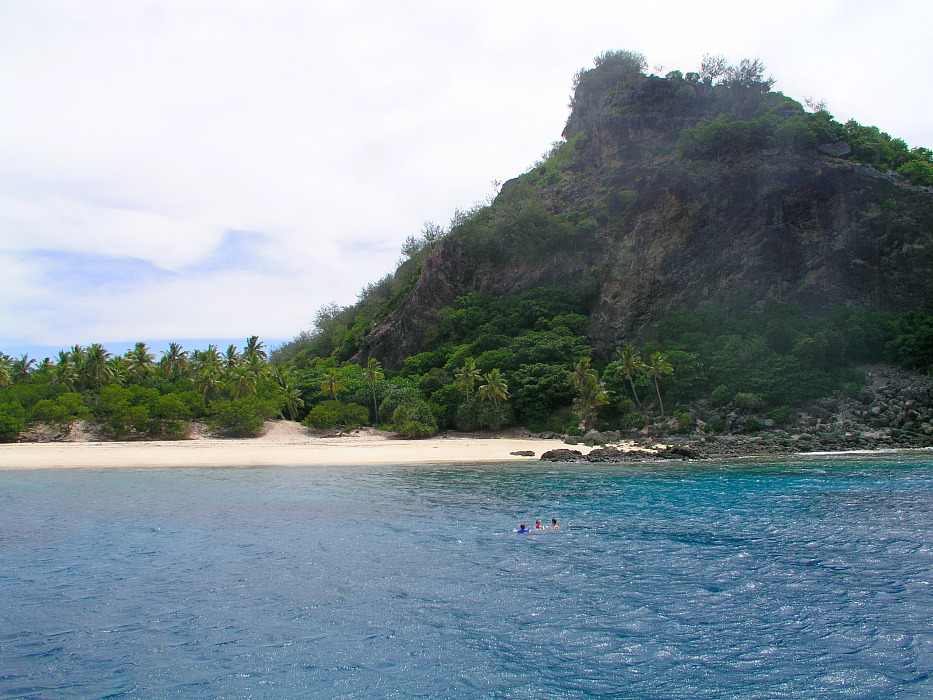
Monuriki Island, Mamanuca archipelago, Fiji. Courtesy of Wikipedia.
Suva is the capital of Fiji, found on the island of Viti Levu. Also the largest city in Fiji and in the South Pacific, Suva is home to nearly 86,000 people (over 172,000 in the metro). Suva is situated on a peninsula and has mountains to the north and west, allowing the southeast trade winds to produce rain year round.
A few more facts about Suva (courtesy of Wikipedia):
- Time zone: Fiji Standard Time (UTC+12)
- Elevation: 0 to 25 ft above mean sea level
- Climate zone: Tropical rainforest
- Average high temperature: 84 °F (29 °C)
- Average low temperature: 68 °F (20 °C)
- Record high temperature: 99 °F (37 °C)
- Record low temperature: 55 °F (13 °C)
- Average annual precipitation: 117 inches (2,980 mm)
Like Puerto Ayora in the Galápagos Islands, temperature only varies by a few degrees throughout the year in Suva. The average high in Suva is only a few degrees above the average high in Puerto Ayora, and the average lows of both cities are the same.
Also like Puerto Ayora, Suva tends to be warmer and wetter from December to May and cooler and drier from June to November.
However, unlike Puerto Ayora, Suva receives copious rainfall; in fact, Suva receives about 13 times as much rain as Puerto Ayora!
Both cities are located on the coast of an island in the tropical Pacific (Suva is at about 18°S, while Puerto Ayora is nearly on the equator), but the big difference comes in the location of each island.
The western Pacific receives more rain than the eastern Pacific for numerous reasons, including more hurricanes in the western Pacific and prevailing wind direction. Easterly trade winds push warm water (and warm, moist air) towards the west, while cold water wells up from beneath the surface (to replace the surface water that’s been pushed west) on the west tropical coast of South America. Water temperature greatly affects air temperature in the tropics, so temperatures will tend to be a little cooler (and air drier) on the eastern edge of an ocean basin and vice versa on the western edge. As mentioned above, Suva is also moist because it is on the southeast coast with mountains to the north and west, so the southeast trade winds bring moisture right into the area. The northwest coasts of Fiji islands are much drier.
Current weather: Rain showers, with highs in the mid-80s and lows near 70 °F.
For more information on Suva, here’s a link to Wikipedia. For more information on Fiji, here’s another link to Wikipedia.
For weather maps and information on current and forecast Fiji weather, see the Fiji Meteorological Service (check out their hand-drawn weather maps), WeatherZone (Australian weather site with weather info for all over the world) and Weather Online UK (collection of maps and weather information for all over the world).
Next Tuesday we’ll look at the weather in Antarctica. As always, if you have any comments or suggestions for future cities, please leave a comment on this post!
Permalink
08.16.10
Posted in General News, Photography at 6:07 pm by Rebekah
Prints of my storm chase photos are now available for purchase on my website marketplace.
Currently, only selected photos from 2010 storm chases are posted in the photo gallery. More photos will be continue to be posted in upcoming weeks.
If you encounter any problems with the marketplace photo gallery, please let me know.
I am also working on a storm chasing highlights DVD for 2010 (for more details, see the marketplace). I hope to have it ready for sale by early November, if not sooner.
Permalink
08.11.10
Posted in Weather News at 7:35 pm by Rebekah
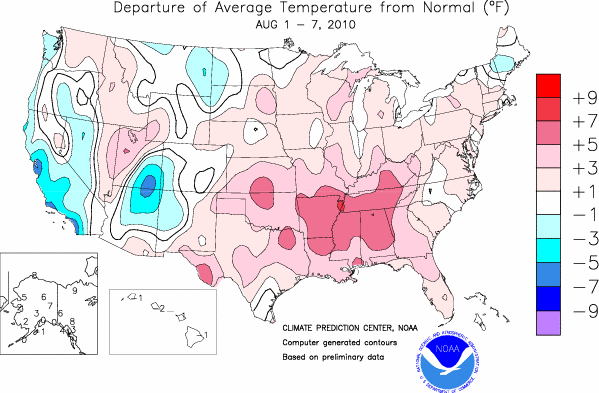
For much of the central and eastern U.S., it has been a pretty hot summer.
Take a look at the map below, from the Climate Prediction Center, showing average temperature anomalies across the country over the past week.
Now look at an ensemble model map showing the average 500 mb height anomaly from this morning, from the Earth Systems Research Laboratory.
(Put very simply, green to orange shading means pressure is higher than normal, while blue shading means pressure is lower than normal. 500 mb heights are the gray lines on the map.)
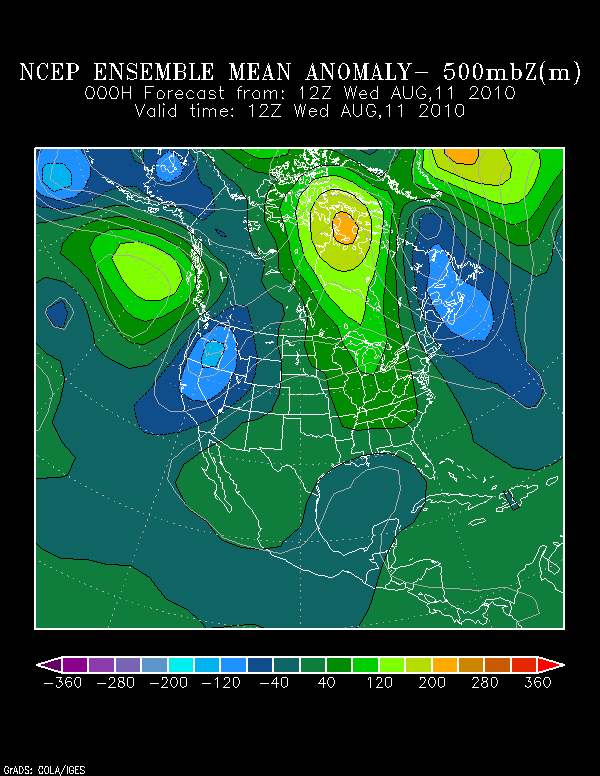
Notice any similarities to the first map?
A ridge of high pressure has brought above normal temperatures to the central and eastern U.S., while a trough of low pressure over the West Coast has brought below normal temperatures to the coast, especially to California.
Good news for those of us in the central U.S., though–models are showing a cold front coming through Kansas and Oklahoma by early next week, as the ridge finally breaks down and allows a large trough to progress through the northern U.S.
Temperatures should finally drop a few degrees and we may actually get the chance for some storms along the front!
Permalink
08.10.10
Posted in Non-US Weather, Weather News at 5:02 pm by Rebekah
This week’s post in the global weather and climate series features Puerto Ayora, in the Galápagos Islands.
-
-
-
-
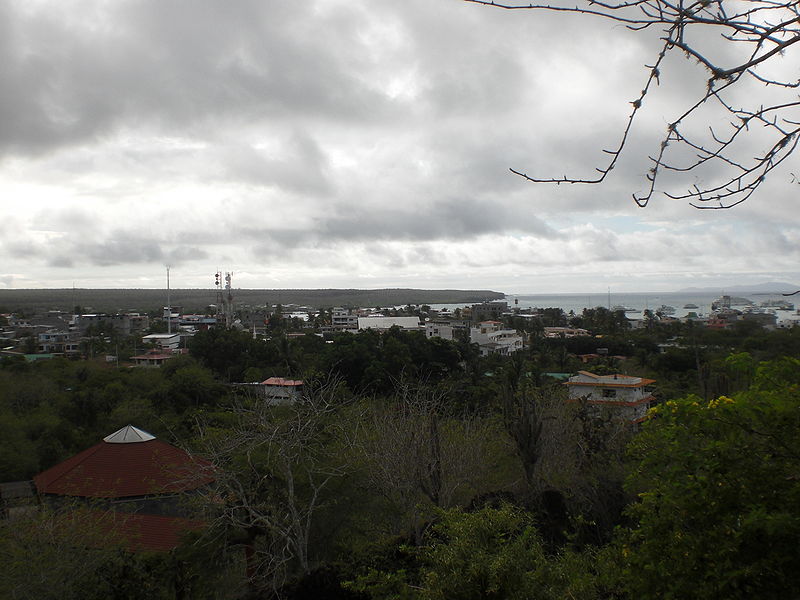
Puerto Ayora skyline. Courtesy of Wikipedia.
The Galápagos Islands are an archipelago of 18 volcanic islands that are governed by the country of Ecuador, located about 600 miles to the east. Situated on and near the equator, the Galápagos Islands are known for their wide variety of animals. The islands were discovered by the Spanish in the early 16th century, but until the early 19th century, they were frequently used as hideouts by English pirates who preyed on Spanish ships carrying riches from South America to Spain. The Galápagos Islands are also famous for being the study area of Charles Darwin, who sailed there on the HMS Beagle in 1835.
On the southeastern coast of Santa Cruz Island, Puerto Ayora is the largest city in the Galápagos Islands. Puerto Ayora is home to about 18,000 people (there are about 23,000 in the entire island chain) as well as the Charles Darwin Research Station, a biological research station focused on conservation of the Galápagos Islands’ terrestrial and marine ecosystems.
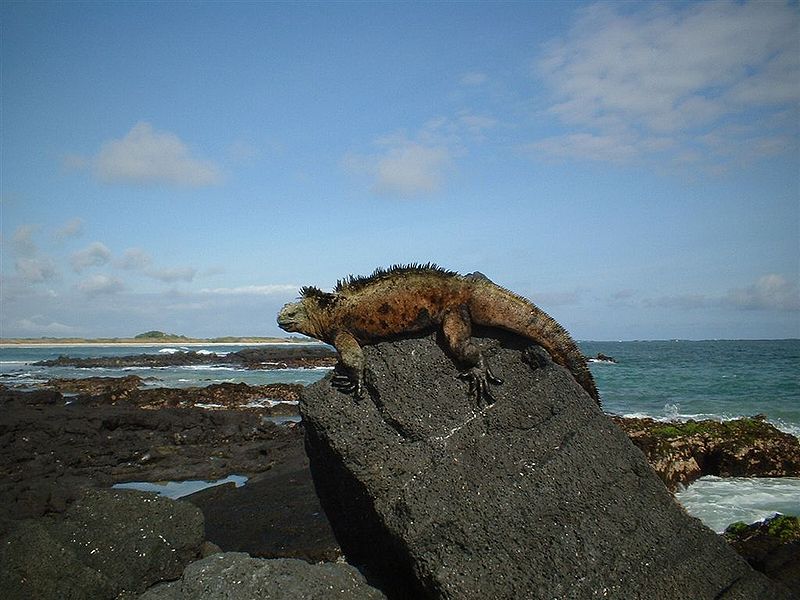
Marine iguana in the Galápagos Islands. Courtesy of Wikipedia.
A few more facts about Puerto Ayara (weather data from Eos Ecuador, averaged over the islands):
- Time zone: Galápagos Time (UTC-6)
- Elevation: 0 to 52 ft above mean sea level
- Climate zone: Tropical
- Average high temperature: 80 °F (27 °C)
- Average low temperature: 68 °F (20 °C)
- Average annual precipitation: 9 inches (230 mm)
Weather in the Galápagos Islands is warmer and wetter from January to June and cooler and drier from July to December. During El Niño, temperatures are warmer and rainfall is greater, while during La Niña, temperatures are cooler and rainfall is less.
Temperatures do not vary much on the islands, especially on the coastlines.
Current weather: Puerto Ayora is currently in the dry season, when any precipitation that does fall is generally in the form of drizzle. This week, Weather Underground is forecasting high temperatures from 69 to 71 °F and lows from 66 to 68 °F (not much variability, as the temperatures are primarily governed by the water temperature). Skies will usually be clear, with the exception of Wednesday and Friday, when there is a 20% chance for trace amounts of rain.
For more information on Puerto Ayora, here’s a link to Wikipedia. For more information on the Galápagos Islands, here’s another link to Wikipedia.
For weather maps and information on current and forecast Galápagos Islands and Ecuadorian weather, see the Instituto Nacional de Meteorología e Hidrología (Ecuador’s national weather service, in Spanish) and Weather Online UK (collection of maps and weather information for all over the world).
Next Tuesday I plan to take a look at the climate and weather in another part of the globe. As always, if you have any comments or suggestions for future cities, please leave a comment on this post!
Permalink
« Previous Page — « Previous entries « Previous Page · Next Page » Next entries » — Next Page »
