01.21.11
Posted in Uncategorized at 8:00 am by Rebekah
The Mud March was the ill-fated attempt by Union Army Major General Ambrose Burnside to defeat Confederate General Robert E. Lee in the Civil War near the Rappahannock River south of Fredericksburg, Virginia.
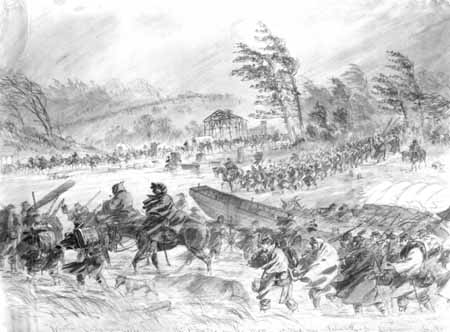
The Mud March. From “Washington Weather“
Background
In December 1862, Burnside led a frontal attack on Lee’s army near Fredericksburg. The Confederate Army of Northern Virginia soundly beat the Union Army of the Potomac, however, and the Battle of Fredericksburg came to be known as one of the most one-sided battles of the Civil War.
The Plan
In January 1863, Burnside, desperate to restore his reputation and the morale of his army, planned another surprise attack on Lee’s army just south of Fredericksburg. His army would cross the Rappahannock River to flank the Confederates, while the Union cavalry would cross the river 20 miles to the north and then come in from the rear.
President Abraham Lincoln found out about the plan and believed it was too risky, but Burnside only changed the point of his river crossing, by moving further upstream.
The Mud March
On January 20, 1863, the anticipated day of attack, a strong extratropical cyclone began to move up the East Coast. The nor’easter brought heavy rainfall to the coast and snowfall further inland. The rain continued for two days (Washington, DC reported 3.2 inches of rain), saturating the ground and turning the dirt roads into thick mud. Gale-force winds also blew and temperatures near Fredericksburg were in the upper 30s.
Burnside tried to keep going, but after the troops struggled to move in knee-deep mud, the wagons got buried up to their wheel hubs, the artillery got stuck, and teams of horses and mules became exhausted and died, he finally listened to the complaints of his army and decided to head back to camp. Reportedly, a team of a dozen horses and 150 men could not pull even one cannon out of the mud. Eventually, after placing logs on the mud, the army was able to make it out of the mess and get back to camp. The soldiers derisively called the trek the “Mud March”.
After Effects
On January 26, President Lincoln replaced Burnside with Major General Joseph Hooker. The Mud March was the last attempted major winter offensive during the Civil War.
Side note: Burnside had at the time what was considered rather unusual facial hair. The strips of hair down the sides of his face came to be called “burnsides“, and later what today we call sideburns.
——————–
Sources: Washington Weather and Wikipedia
Permalink
01.20.11
Posted in Weather Education, Weather Myths at 8:00 am by Rebekah
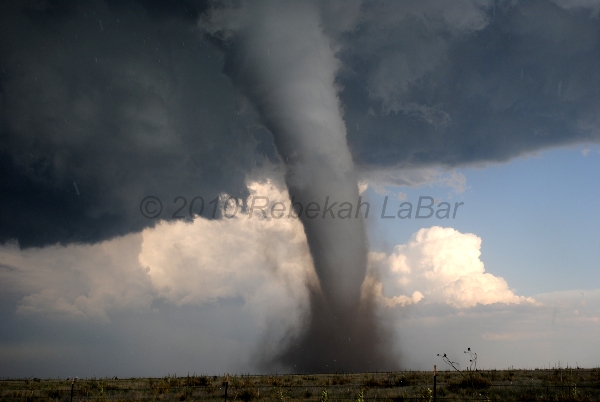
Here are a few myths about tornadoes that you might have heard.
- Myth: “You should open windows to equalize air pressure.”
- Fact: Although tornadoes may have a low pressure center, houses are well-ventilated and pressure differences would be equalized well before explosive pressure drops came close enough to the house. Opening windows is a waste of time and may just bring more flying debris into your home.
- Myth: “You should always shelter from tornadoes in the southwest side of your house.”
- Fact: Tornadoes often come from the southwest, which is possibly related to how this old myth got started. Instead, you should hide in the center of your house, in a closet, underneath heavy furniture, or under a stairwell.
- Myth: “A highway overpass is a good tornado shelter.”
- Fact: Although a TV station video from Kansas in 1991 showed that people got apparent protection under an overpass, they were just providentially spared (not to mention the tornado did not come directly over them, as presumed). An overpass actually creates a wind tunnel effect, such that the winds under the overpass can actually be even stronger than the winds in the tornado. You would also be directly exposed to flying debris. People have been killed hiding under overpasses (most notably on May 3, 1999 in Oklahoma City). Instead, if you are in a car and a tornado is nearby, you should drive away, if possible, or take shelter in any nearby buildings (staying inside a stationary car is not a good idea).
- Myth: “My town is protected from tornadoes by a river, hill, valley, Indian burial ground, etc.”
- Fact: The idea that your town is protected is a combination of perhaps wishful thinking, a short memory, and the rarity of tornadoes. Tornadoes don’t care about surface features, though, they are more driven by what’s going on aloft. When I moved to Norman, I heard that there was a “bubble” or “dome” that seemed to keep tornadoes in Oklahoma City but not Norman. Norman had been struck by tornadoes in the 70s and 80s, but not for a while. Well, the so-called “bubble” was popped recently, as east Norman was hit by a tornado in June 2009 and again by an EF4 tornado in May 2010.
Permalink
01.19.11
Posted in Weather - Miscellaneous at 8:00 am by Rebekah
What’s the difference between a watch and a warning?
Watch
- conditions are favorable for the weather event in question (be prepared!)
- typically covers a large geographic area
- typically lasts for several hours (e.g., tornado watches may last 6 hours, but hurricane watches may last 36 hours)
- issued by your local National Weather Service office, except for tornado and severe thunderstorms watches (issued by the Storm Prediction Center in Norman, Oklahoma) and hurricane watches (issued by the National Hurricane Center in Miami, Florida)
Warning
- the weather event in question is already occurring or is likely to occur very soon (take protective measures now!)
- covers a small geographic area (perhaps only a county or two)
- lasts for a shorter period of time (e.g., tornado warnings may last 30 minutes…the exception is a hurricane warning, which means conditions are likely in 24 hours)
- issued by your local National Weather Service office, except for hurricane warnings (issued by the National Hurricane Center)
Permalink
01.18.11
Posted in Non-US Weather, Weather News at 8:00 am by Rebekah
This week’s post in the global weather and climate series features Ushuaia, Argentina.
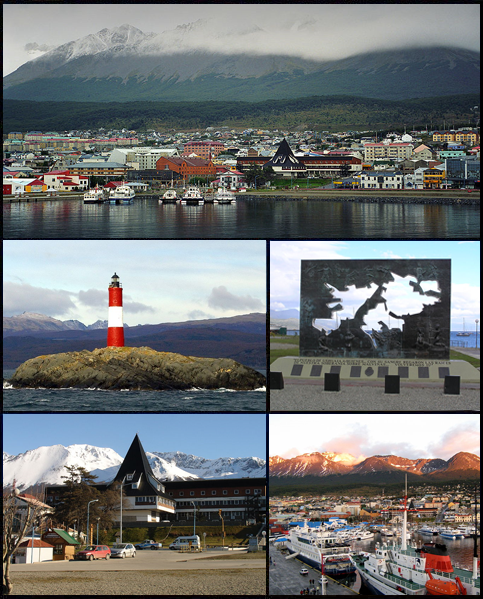
Montage of Ushuaia, Argentina, in the Tierra del Fuego. Source: Wikipedia
Ushuaia is the capital city of Tierra del Fuego Province, in southern Argentina. Widely regarded as the southernmost city in the world, Ushuaia is situated on the southern coast of Isla Grande de Tierra del Fuego, with the Martial Mountains to the north and the Beagle Channel to the south. Tierra del Fuego (in English, “Land of Fire”) is an archipelago on the southern end of South America; the southernmost point on the southernmost island is Cape Horn.
The island chain was first visited by Europeans (on Ferdinand Magellan’s voyage) in 1520, although natives had lived in this region for hundreds of years before then. British missionaries gave the city its name in the mid-1800s, as they were the first to really settle in Ushuaia. The population increased in the 1880s, following rumors of gold, but the rumors proved to be false. In 1896, a federal prison was established in Ushuaia; the president of Argentina had been pushing for the city to become a penal colony since 1873.
Today, Ushuaia has a (2010 estimated) population of 63,280. The primary economic activities include fishing, natural gas and oil extraction, sheep farming, and ecotourism.
A few more facts about Ushuaia:
- Time zone: Argentina Time (UTC-3)
- Average elevation: 16 feet (5 meters)
- Climate zone: Subpolar oceanic
- Average high temperature: 49 °F (9 °C)
- Average low temperature: 35 °F (2 °C)
- Average annual high/low temperature range: 40 to 57 °F (4 to 14 °C) / 29 to 42 °F (-2 to 5 °C)
- Record high temperature: 85 °F (29 °C)
- Record low temperature: -13 °F (-25 °C)
- Average annual precipitation: 21 inches (530 mm)
Weather: At nearly 55 °S, Ushuaia experiences short, cool summers and long, somewhat wet and cold winters. The climate of Tierra del Fuego may be compared to that of the Aleutian Islands. The southern tip of South America frequently gets hit by low-pressure systems, and this week is no different.
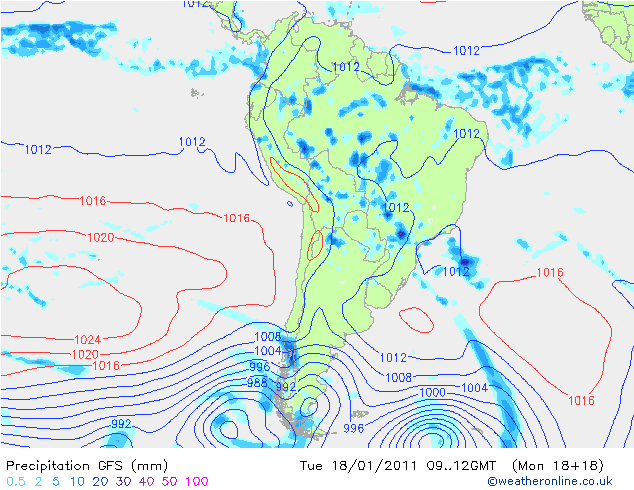
GFS model forecast for surface pressure and precipitation over South America this morning…note the lows (blue concentric circles) on the bottom of the map. Click to enlarge. Source: Weather Online UK
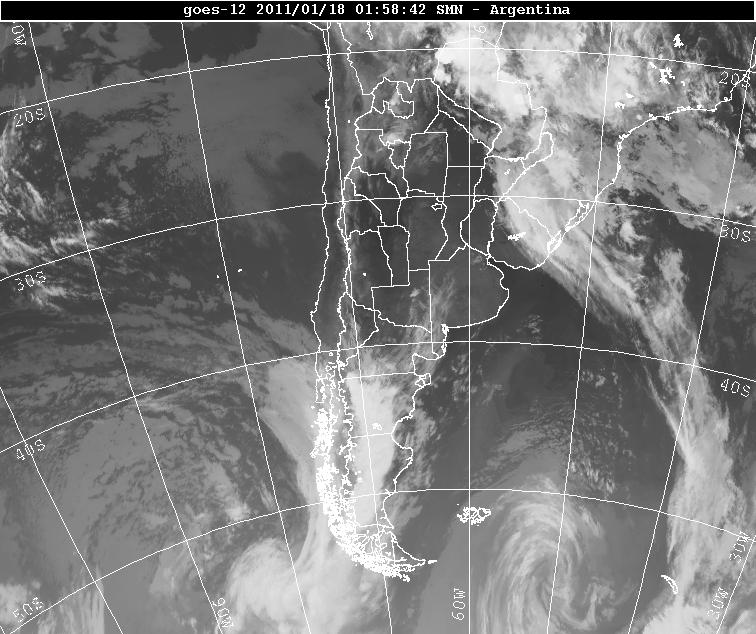
Infrared satellite image of southern South America from last night. Note the two swirls at the bottom of the image; those are the low-pressure systems (moving from west to east). Source: Servicio Meteorológico Nacional
There is a chance of rain every day and night this week for Ushuaia; but then again, the average number of rainy days per year for Ushuaia is 214. It is also pretty windy down there…winds this week may range from about 10 to 30 mph, mostly from the west. Temperatures are pretty typical for this time of year, with forecast highs in the lower 50s and lows in the upper 30s.
For weather maps and information on current and forecast Ushuaia weather, see the Servicio Meteorológico Nacional (Argentinian National Weather Service), Weather Underground, and Weather Online UK.
For more information on Ushuaia, here’s a link to Wikipedia.
Next Tuesday we will take a look at the climate and weather in another part of the globe. As always, if you have any suggestions for future cities, please leave a comment!
Permalink
01.17.11
Posted in Weather Education at 8:00 am by Rebekah
Last Monday we defined the elements of weather as temperature, pressure, wind, moisture, clouds, precipitation, and visibility. We then took a look at temperature, including what it is and how we define the layers of the atmosphere by temperature (troposphere, stratosphere, mesosphere, and thermosphere).
Today we’re going to look at atmospheric pressure.
————————————————–
Pressure
Pressure is simply defined as force per unit area.
When you sit down on a chair, you are exerting a certain amount of pressure upon the chair due to your weight. Now imagine sitting on a much smaller chair…if the chair is small enough, it’s possible that it might break, as your weight is now distributed across a much smaller surface area (read: the pressure is higher).
Wherever you are on earth, there is a “column” of air above you that is exerting pressure on you (due to the weight of the air molecules). This is what we mean by atmospheric pressure.
Pressure Units
- Pounds per square inch (psi)
- Inches of mercury (in. Hg) – old mercury barometers measured pressure based on how high the mercury rose in a glass tube
- Millibars (mb) or hectoPascals (hPa) – meteorological measurement of pressure (1 mb = 1 hPa)
Ideal Gas Law
While the atmosphere is not entirely made up of ideal gases, the ideal gas law is still a good representation of how air behaves based on the temperature, pressure, and volume. In terms of a column of air sitting above a certain point, the ideal gas law is as follows:
pV = nRT
- p = pressure exerted by air column
- V = volume of air column
- n = number of air molecules in the column
- R = gas constant
- T = temperature of the air column
Changes in Pressure
Based on the ideal gas law, we can make a few assumptions, all of which should be fairly intuitive:
- If the volume goes up, the pressure goes down…think about 20 marbles moving around inside a container; if you put those marbles inside a larger container, and they’re still moving at the same speed, then you would expect there to be less pressure with the larger container
- If the number of molecules goes up, the pressure goes up…now put 20 more marbles inside the container, all moving at the same speed; you should expect the pressure to be higher now
- If the temperature goes up, the pressure goes up…let’s say the marbles speed up, symbolizing a higher temperature; you should expect the pressure to be higher, as the marbles are now hitting the sides of the container more frequently
Pressure Structure of the Atmosphere
Meteorologists use pressure as a vertical coordinate (we often use it instead of altitude). As you would expect, pressure decreases as you go up…remember that airplane cabins must be pressurized and mountain climbers must carry oxygen as the air is so thin.
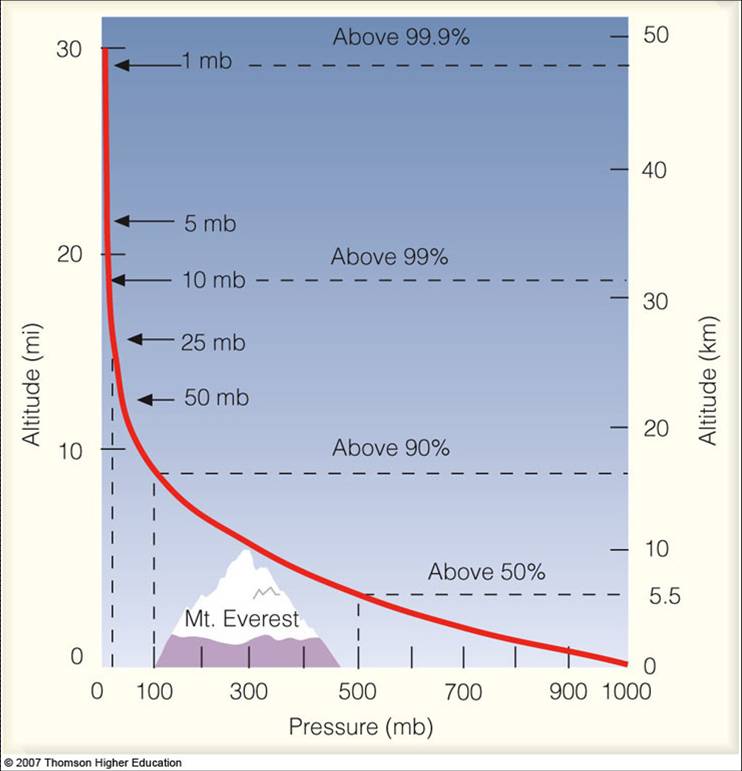
Source: Lyndon State College
Sea-level pressure is 1013 mb. A strong high pressure system might have a pressure of 1040 mb, while a strong low-pressure system might have a pressure of 960 mb (some hurricanes have a pressure as low as 900 mb).
Pressure Corrections
Since the surface pressure at Denver is always going to be lower than the pressure at San Francisco, we do have to make a slight correction for height. We calculate what we call the mean sea-level pressure (MSLP) at every location, so we sort-of level the ground to calculate what the pressure would be at that location if there were no mountains (otherwise, it would look like there is always a low-pressure system over the mountains).
————————————————–
Come back next Monday to learn about the wind, another element of weather related to pressure.
Permalink
« Previous Page — « Previous entries « Previous Page · Next Page » Next entries » — Next Page »


