02.17.11
Posted in Non-US Weather, Tropical Weather, Weather News at 8:00 am by Rebekah
Check this out! Isn’t the track of this low bizarre?
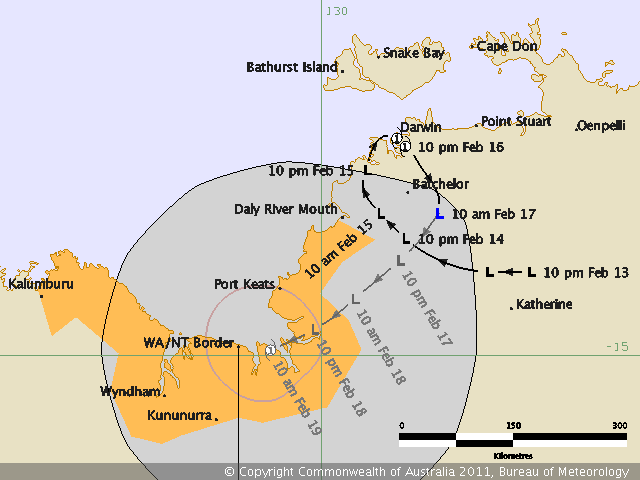
Ex-Tropical Cyclone Carlos’ path. From the Bureau of Meteorology
Darwin, Australia has received over 2 feet of rain from this system over the past 3 days or so, and the winds have toppled a number of trees!
Permalink
02.13.11
Posted in Non-US Weather, Tropical Weather, Weather News at 1:20 pm by Rebekah
Intense Tropical Cyclone Bingiza (see southwest Indian Ocean ratings) now has 10-minute average sustained winds of 105 mph and a minimum pressure of 953 mb (equivalent of a Category 3 on the Saffir-Simpson Scale). The tropical cyclone is still slowly moving towards northeastern Madagascar at 5 mph, and is expected to now in about 24 hours (late Monday night local time).
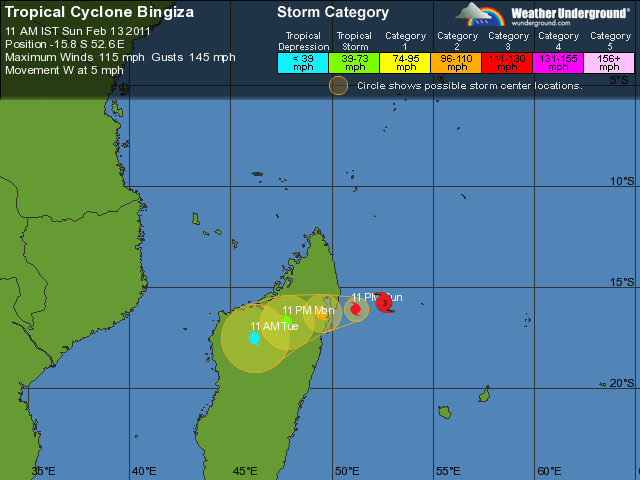
Forecast track of Tropical Cyclone Bingiza, from Weather Underground
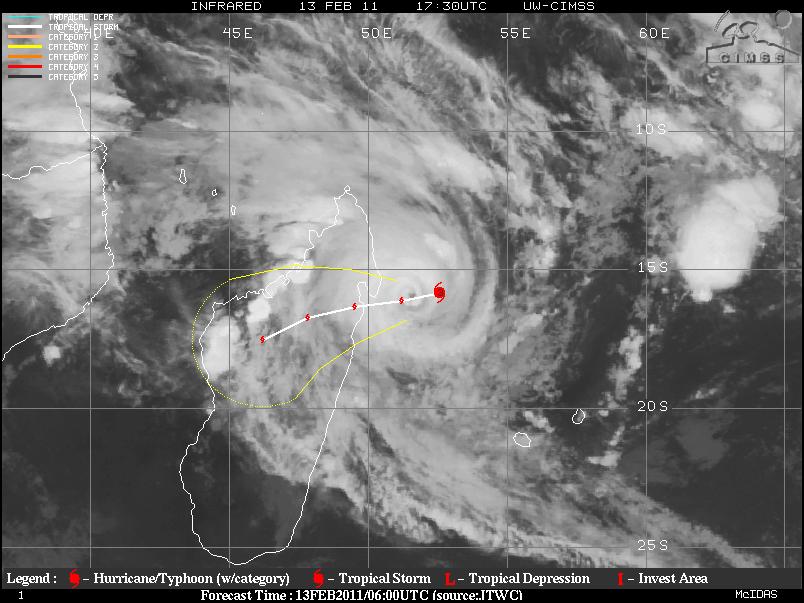
Tropical Cyclone Bingiza, from UW-CIMSS
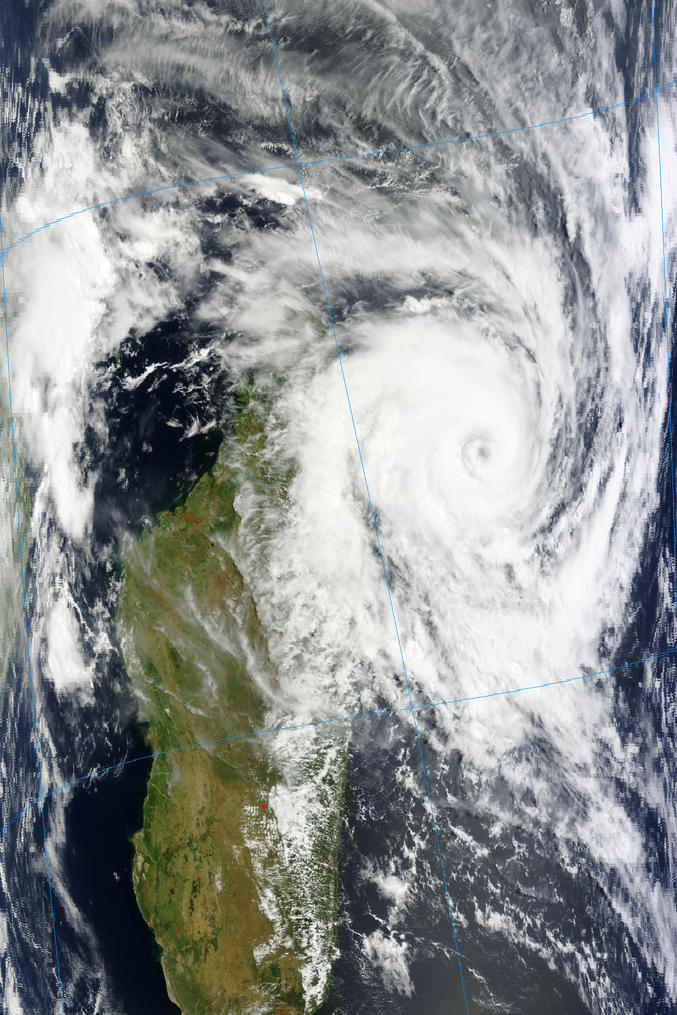
Tropical Cyclone Bingiza, from Terra/MODIS
The tropical cyclone is still headed for the farming towns of Manambolosy, Mananara Nord, and Soanierana Ivongo, as well as affect a tiny, offshore island called Île Sainte-Marie.
See also the post earlier today on Bingiza.
Permalink
Posted in Non-US Weather, Tropical Weather, Weather News at 8:00 am by Rebekah
Tropical Cyclone Bingiza, with 10-minute average sustained winds of 90 mph and a minimum pressure of 963 mb (equivalent of a Category 2 on the Saffir-Simpson Scale), is slowly inching its way towards northeastern Madagascar. The tropical cyclone is currently moving west-southwest at 3 mph.
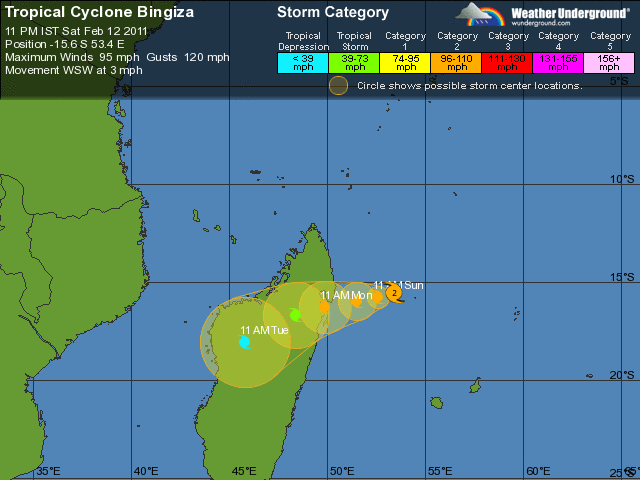
Forecast track of Tropical Cyclone Bingiza, from Weather Underground
The cyclone is expected to make landfall at about this intensity late Monday morning local time (Sunday night U.S. time).
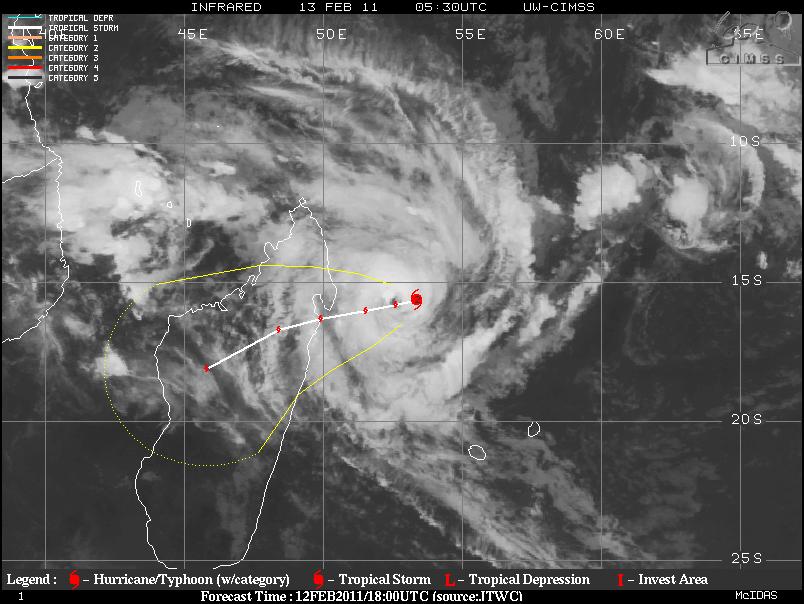
Tropical Cyclone Bingiza, from UW-CIMSS
It appears that the cyclone’s eye will make landfall near the farming towns of Manambolosy (~11,000 people), Mananara Nord (~30,000), and Soanierana Ivongo (~22,000), as well as affect a tiny, offshore island called Île Sainte-Marie (~17,000).
Madagascar is no stranger to tropical cyclones. The southwest Indian Ocean’s most intense cyclone in recorded history struck this same part of Madagascar in March 2004, causing devastating damage. Cyclone Gafilo was the equivalent of a Category 5 on the Saffir-Simpson Scale, with a minimum central pressure of 895 mb and 10-minute sustained winds of 145 mph (1-minute sustained winds of 160 mph).
To see more on different tropical cyclone rating systems in different ocean basins, see another blog post I wrote, “Tropical Cyclone Ului Makes Landfall in Australia“.
To see a recent blog post I wrote on the weather and climate of the nearby capital of Madagascar, Antananarivo, check out “World Wide Weather #25: Antananarivo, Madagascar“.
Bingiza is the fifth tropical disturbance and the second named storm of the Southwest Indian Ocean tropical cyclone season, which begun on November 15th and will run until April 30th.
Permalink
02.10.11
Posted in Non-US Weather, Tropical Weather, Weather News at 4:14 pm by Rebekah
Parts of Australia have been flooding for the past couple of months now. With even more rainfall following Tropical Cyclone Yasi’s landfall last week, how is the country doing lately in terms of rainfall amounts and river heights?
February 3 – February 10 rainfall totals (Bureau of Meteorology)
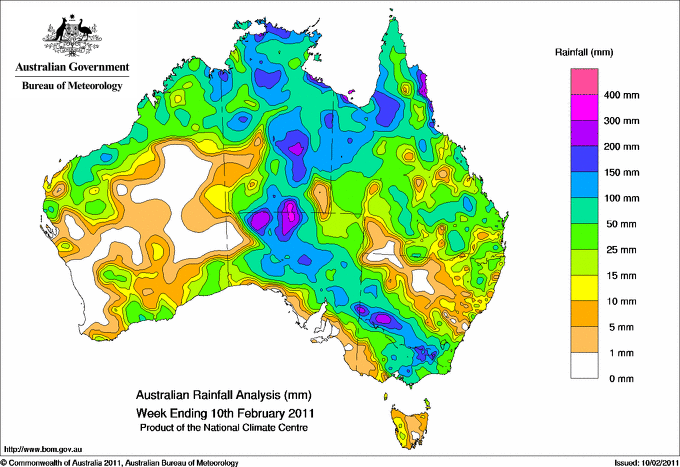
The biggest thing that pops out at me from this map is the swath of higher rainfall from northern Queensland southwestward to the south central part of the Northern Territory, as a result of Tropical Cyclone Yasi, as well as the swath of rain from north central South Australia southeastward through northern Victoria / southern New South Wales, as a result of a trough of low pressure.
Current river conditions (Bureau of Meteorology)
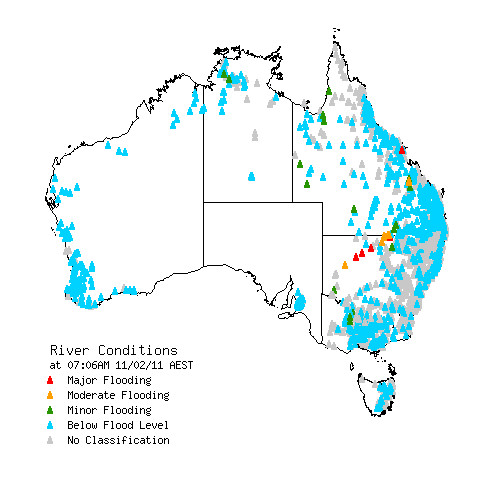
This map is better than those from a few weeks ago (see below); most of the rivers are below flood level now, with the exception of a few in Queensland and New South Wales.
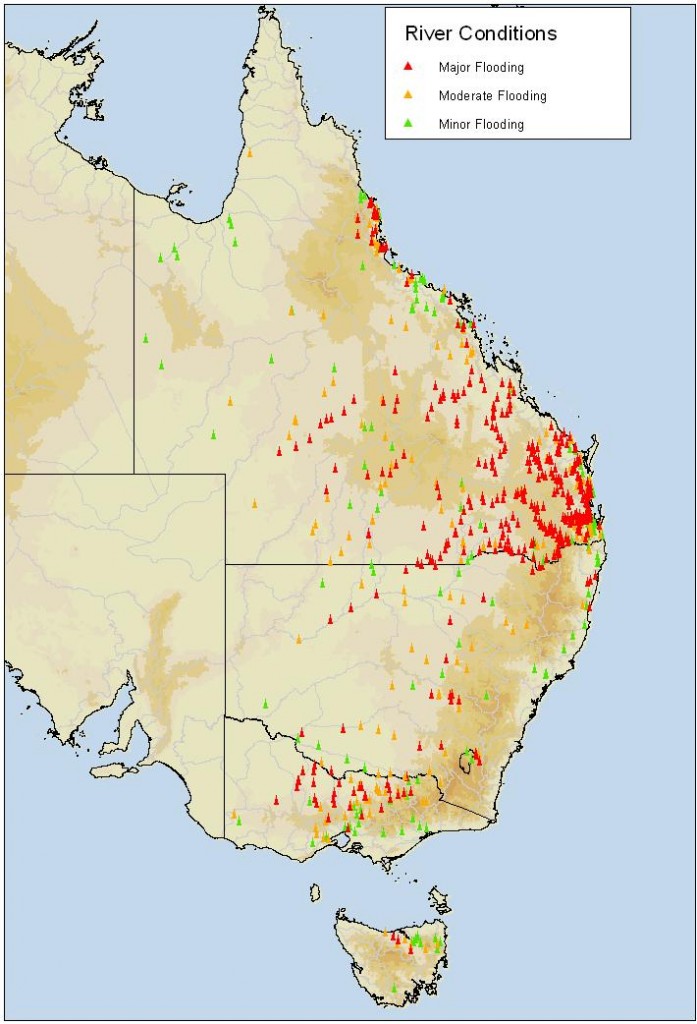
November 26 – January 20 peak river conditions (Bureau of Meteorology)
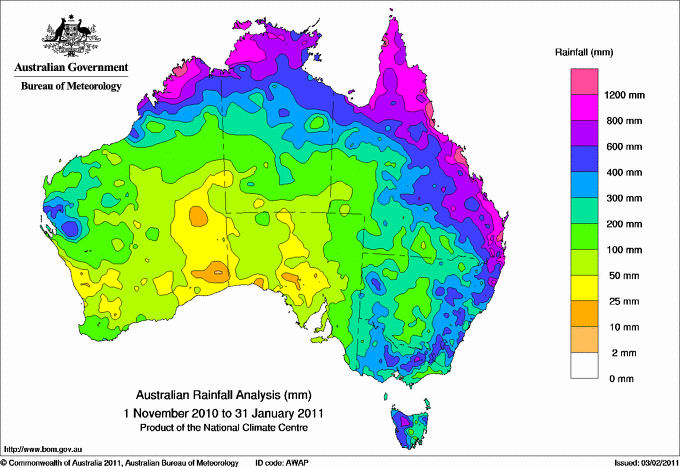
Now for a look at some rainfall maps from over the past three months…
November 1 – January 31 rainfall totals (Bureau of Meteorology)
November 1 – January 31 rainfall anomalies (Bureau of Meteorology)
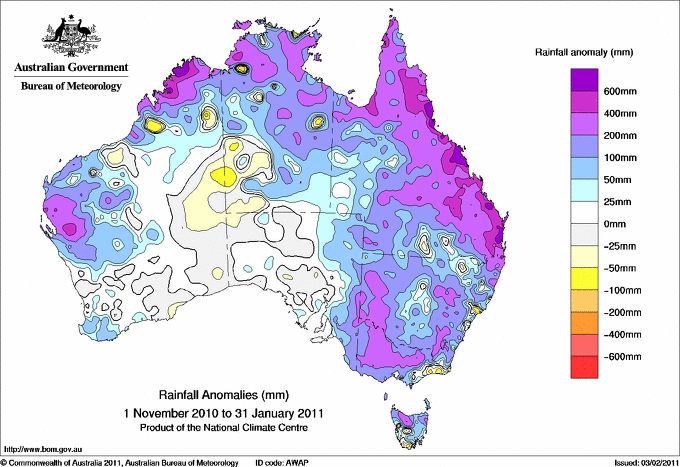
Wow, many coastal areas received well above average rainfall! Now how does this rainfall compare to the average rainfall?
November 1 – January 31 rainfall percentages (Bureau of Meteorology)
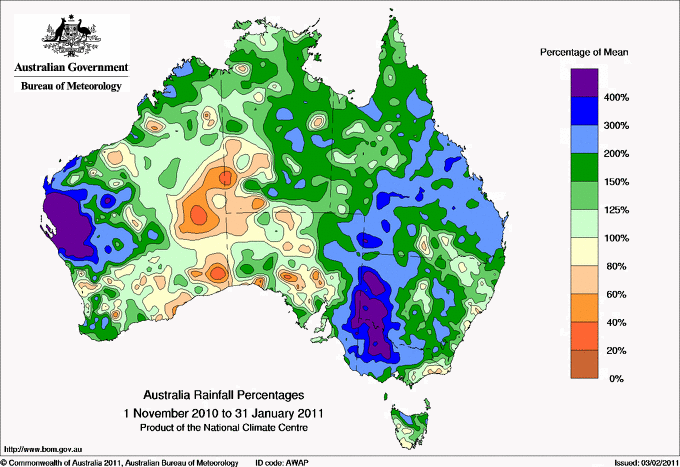
Okay, so most of eastern Australia experienced above average rainfall from November through January. More specifically, western New South Wales and Victoria had well above average rainfall, as well as the west central coast of Western Australia.
Now how does this compare to the records?
November 1 – January 31 rainfall deciles/records (Bureau of Meteorology)
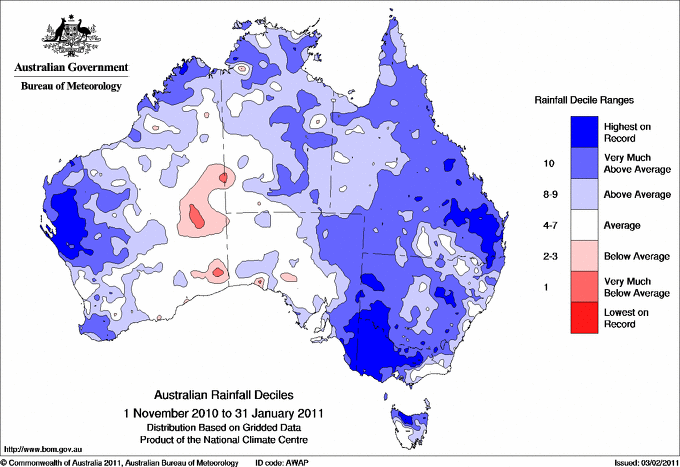
This map shows that the rainfall in most of eastern Australia was well above average…much of Victoria, western New South Wales, and southeastern Queensland broke all-time rainfall records. That’s a pretty large record-breaking area! Note also that the west central coast of Western Australia has also received the highest amount of rainfall on record.
Has the rain affected the temperatures much? Absolutely.
November 1 – January 31 mean temperature anomaly (Bureau of Meteorology)
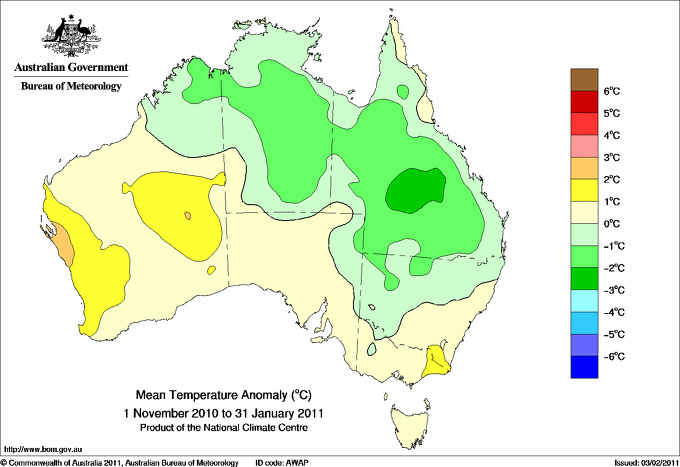
It’s not a coincidence that Queensland’s average temperatures were lower from November through January…the clouds and rain contributed quite a bit to the slightly cooler weather.
For more on Australia’s climate data, check out the following links from the Bureau of Meteorology: Queensland in January 2011: Widespread flooding continued; Special Climate Statement 24 [on frequent heavy rains in late 2010 / early 2011, PDF document]; and Severe Tropical Cyclone Yasi [maps and info]. To see more of the above maps, check out the links posted in the captions.
One more thing: models show another tropical cyclone could develop in the Gulf of Carpentaria next week (and make landfall) and another cyclone off the coast of Western Australia by next weekend (though it would move away).
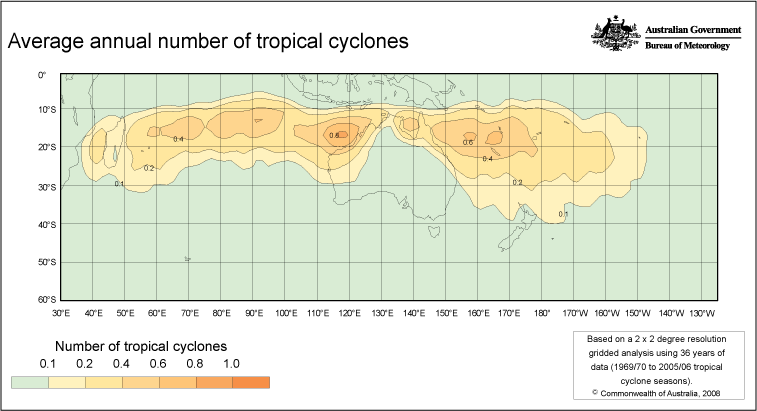
Here’s a map from the BoM showing the average annual number of tropical cyclones around Australia (click to enlarge):
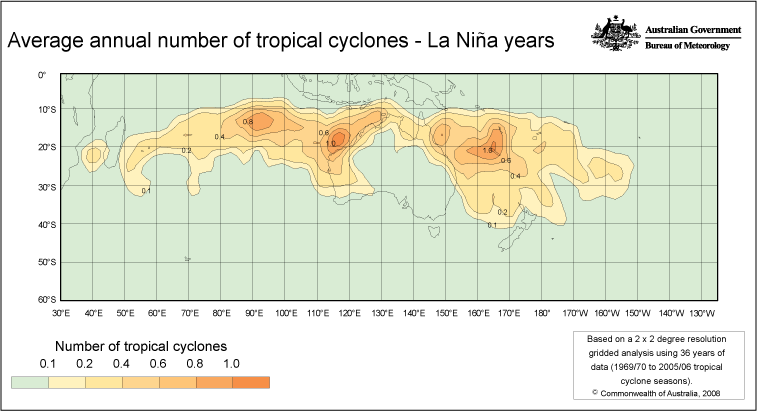
Compare that to a La Niña year, which we’re in now:
Stay tuned and stay safe!
Permalink
02.04.11
Posted in Tropical Weather at 8:00 am by Rebekah
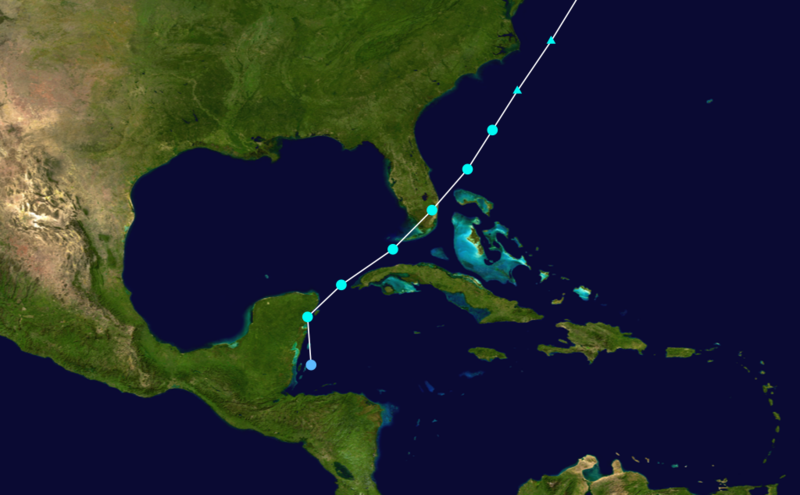
Groundhog Day, 1952: a rare tropical storm formed in the western Caribbean. The tropical cyclone quickly moved north-northwestward, and passed by Cancún before turning northeastward and tracking across the northwest coast of Cuba.
Early the next day, on February 3rd, the tropical storm struck Key West and then made landfall again near Cape Sable, in southern Florida. The Miami National Weather Service office reported a wind gust of 68 mph (110 kph) and a minimum pressure of 1004 mb. There was no serious damage or injuries, though some crops and power lines in southern Florida sustained some damage and 2 to 4 inches of rain fell along the storm’s path.
This tropical storm remains the only tropical cyclone to exist in the Atlantic in February in recorded history.
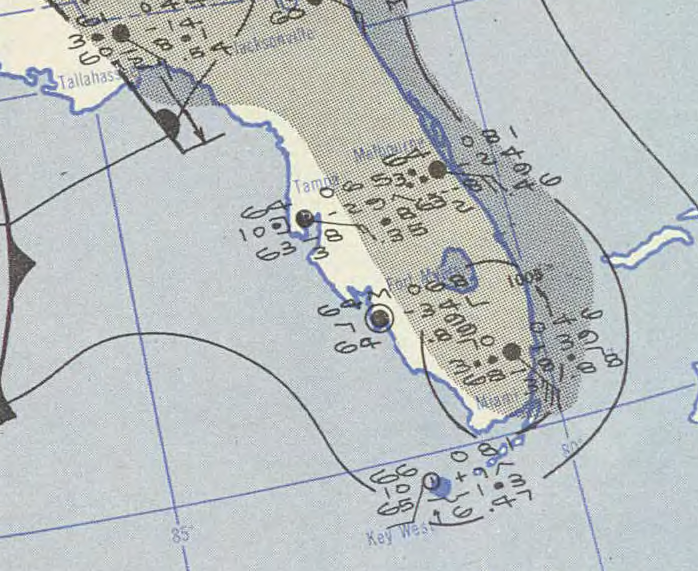
U.S. Weather Bureau (NWS predecessor) surface map on February 2, 1952
After the tropical storm went back to sea, it transitioned into an extratropical cyclone with maximum winds of 85 mph (140 kph) and waves up to 35 feet off the North Carolina coast on the 4th. The cyclone later moved past Cape Cod before coming ashore in Maine on the 5th. Damage included a freighter off the Outer Banks that washed ashore when water entered the fuel line and damaged the engine (the crew was all rescued by the Coast Guard), some downed power poles and tree limbs in the Northeast, and minor power outages.
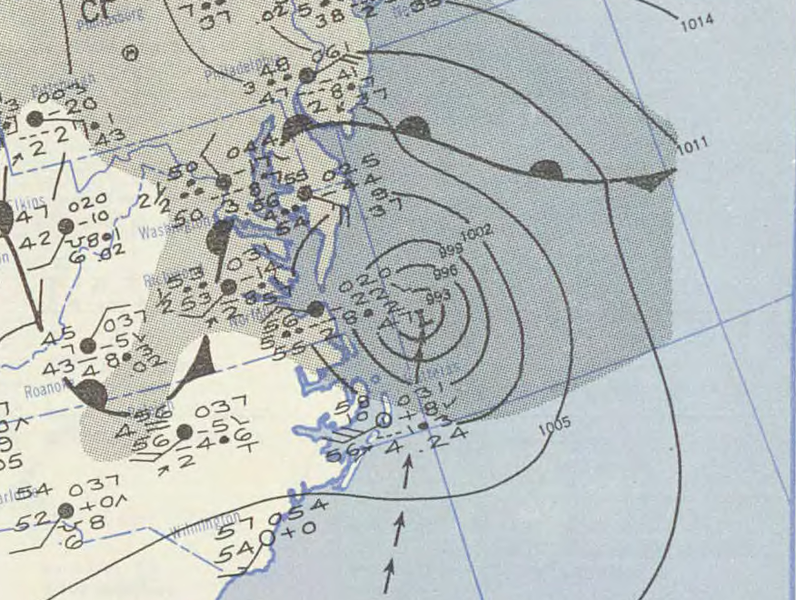
U.S. Weather Bureau surface map on February 4, 1952
The tropical storm was very unusual, and it was initially left out of the official tropical cyclone database. Had it been included right away, the storm’s name would have been Tropical Storm Abel.
Source for much of the information and figures: Wikipedia
Permalink
« Previous Page — « Previous entries « Previous Page · Next Page » Next entries » — Next Page »


