03.31.11
Posted in Uncategorized at 8:00 am by Rebekah
Today marks the first day of the 2011 Major League Baseball season!
Today’s games include Atlanta at Washington, Detroit at the New York Yankees, Milwaukee at Cincinnati, the Los Angeles Angels of Anaheim at Kansas City, San Diego at St. Louis, and San Francisco at the Los Angeles Dodgers.
I predict the Mariners will once again come in last place in the American League West division, with the Rangers taking first place. I hope I’m wrong on both accounts, though. 🙂 I plan on going to see the Mariners play the Rangers in Arlington early next week.
At any rate, I expect the Mariners will be a bit more fun to watch this year, for when your team hits rock bottom (i.e., practically everyone but Ichiro has the worst offensive season of their career), you can only go up, right? The season will be marked with some sadness, though, as the Voice of the Mariners, Dave Niehaus, will no longer be calling the games.
Go Mariners!
Play ball!
NOW it is spring! 🙂
Permalink
03.30.11
Posted in Weather News at 8:00 am by Rebekah
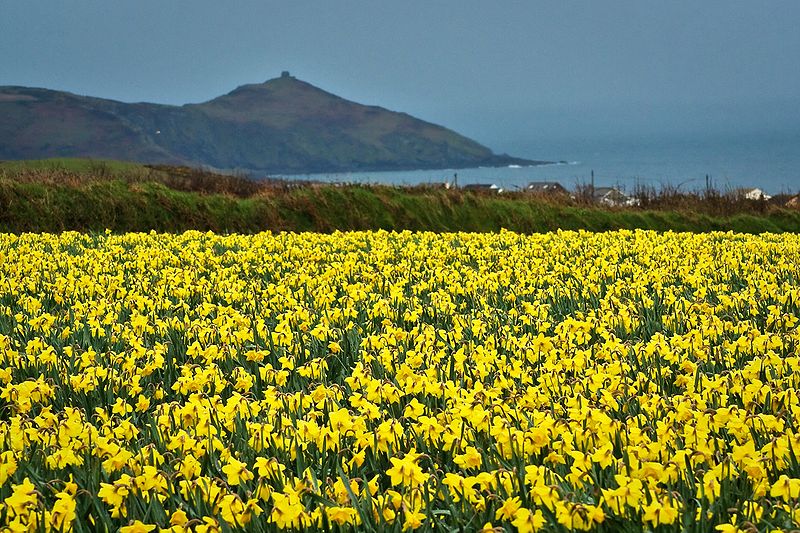
A field of daffodils in Cornwall, England. From Wikipedia
According to the BBC and various other news sources, daffodils in western England, East Anglia, and Scotland are blooming too early. Growers are having a difficult time getting enough people to come and pick the flowers, thus leaving many of the daffodils to go to waste.
Following a cold winter in the United Kingdom, warm, wet weather has allowed the daffodils to peak long before Easter, the most popular time for daffodil purchases (along with Mother’s Day, which is in early April this year in the UK). Easter comes three weeks later this year than last year, and the daffodils are expected to be past their prime by then.
The UK grows over 25,000 varieties of daffodils, exporting many of them to countries such as Denmark, Germany, Holland, and Sweden. The UK produces half of the world’s daffodil bulbs and exports 10,000 tons of daffodil bulbs each year.
The UK Met Office is forecasting high temperatures across England today from about 10 to 13 °C (50 to 55 °F), tomorrow 12 to 17 °C (54 to 63 °F), Friday 12 to 18 °C (54 to 64 °F), and Saturday 13 to 20 °C (55 to 68 °F).
Follow Green Sky Chaser on Twitter and Facebook for weather, chasing, and blog updates.
Permalink
03.29.11
Posted in Non-US Weather, Weather News at 8:00 am by Rebekah
This week’s post in the global weather and climate series features Nairobi, Kenya (click for a Yahoo! maps link).
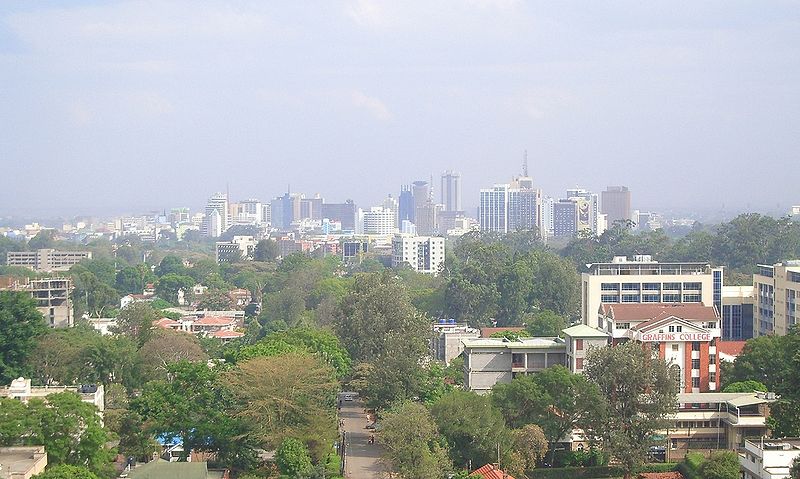
Nairobi skyline, from Wikipedia
Nairobi, just south of the equator, lies on the Nairobi River in south central Kenya. Kenya borders Lake Victoria and the Indian Ocean. Founded as a rail depot in 1899, Nairobi quickly grew and became the capital of British East Africa in 1907.
Today, Nairobi is the capital of and largest city in Kenya, as well as the largest city in east Africa. The population (2009 census) is 3.1 million. Well off financially, Nairobi welcomes many tourists each year. The primary tourist destination is the Nairobi National Park, including giraffes, lions, and rhinos. Nicknames for the city include “The Green City in the Sun” (from the vegetation and warm climate) and “Safari Capital of the World” (from the popular safari tourism).
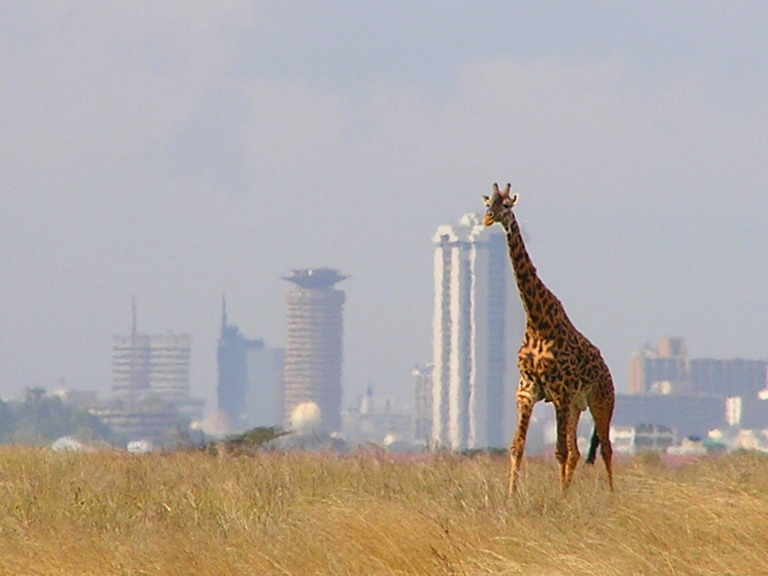
A giraffe in Nairobi National Park, bordering the city of Nairobi in the background. From Wikipedia
A few more facts about Nairobi (from Wikipedia):
- Time zone: East Africa Time (UTC+3)
- Average elevation: 5,450 ft (1,661 m)
- Climate zone: Subtropical highland
- Average high temperature: 74 °F (23 °C)
- Average low temperature: 54 °F (12 °C)
- Average annual high/low temperature range: 69 to 78 °F (21 to 26 °C) / 50 to 57 °F (10 to 14 °C)
- Average annual precipitation: 40 inches (1,024 mm)
Weather: As Nairobi is near the equator, the city experiences fairly warm daytime temperatures throughout the year. However, the city is over a mile above sea level, so nights can be quite cool.
The rainiest months of the year are March through May and November through December.On average, the months of July and August each receive less than one inch of rain.
We’re going into the wettest month; April receives, on average, 8.6 inches of rain over 16 rainy days.
This week is forecast to be especially warm for the area, with highs in the low 80s and lows near 60 °F. Rain is in the forecast for Tuesday through Thursday (it has already been raining there for at least the past week).
For weather maps and information on current and forecast Nairobi and Kenya weather, see the Kenya Meteorological Department, Weather Underground and Weather Online UK (global maps and models).
For a bit more information on Nairobi, here’s a link to Wikipedia.
Next Tuesday I plan to take a look at the climate and weather in another part of the globe. As always, if you have any suggestions for future cities, please leave a comment!
Follow Green Sky Chaser on Twitter and Facebook for weather, chasing, and blog updates.
Permalink
03.28.11
Posted in Weather Education at 8:00 am by Rebekah
Last week in the weather education series we looked at weather satellites. This week we’ll wrap up meteorological measurements with lightning detection networks.
This discussion will be limited to two lightning detection networks: the U.S. National Lightning Detection Network (NLDN) and the 3D Lightning Mapping Array (LMA).
National Lightning Detection Network
The NLDN, established in 1989, is a network of over 100 sensors spread across the United States (there is also a similar lightning detection network in Canada, and together the networks are called the North American Lightning Detection Network).
Put simply, the sensors detect electromagnetic radiation from lightning ground strikes (cloud-to-ground, or CG flashes). The time of the strike, strike location, current magnitude (i.e., strength of the strike), current polarity (e.g., positive or negative), and number of return strokes is recorded for each observed CG flash. The strike location is determined by triangulation.
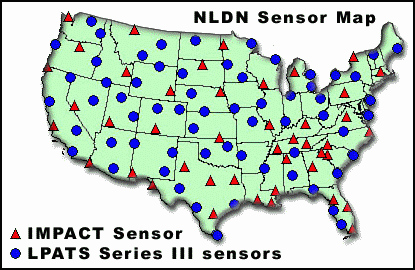
Map of the NLDN sensors. There are two types of sensors indicated on the map.
3D Lightning Mapping Array
There are currently three 3D lightning mapping arrays (LMAs) in operation in the U.S., all set up under the direction of New Mexico Tech. The LMAs are located in New Mexico, central Oklahoma, and northern Alabama.
My work in the lightning research department at the University of Oklahoma has dealt extensively with the Oklahoma LMA, run by a group in the National Severe Storms Laboratory.
The OK-LMA consists of 11 stations in west central Oklahoma, each of which is equipped with a very high frequency (VHF) antenna, to detect the radiation produced by the lightning, and a time-of-arrival sensor, to determine time and location information about the VHF radiation points from both intracloud (IC) and CG lightning flashes.
We can then use this VHF data for various purposes, such as finding out where and when the lightning flash initiated. This was a large part of my research for my M.S. degree.
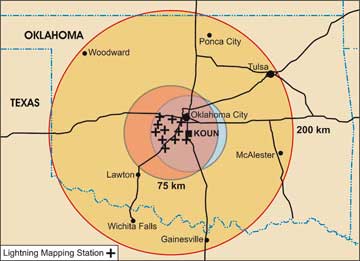
The plus symbols show the location of each LMA station in Oklahoma, the orange circle shows the range of the 3D LMA, and the yellow circle shows the range of the LMA for just 2D data (the inner, pinkish to blue circle is the range of the polarimetric radar KOUN).
————————————————–
Next Monday we will move on to weather maps!
Follow Green Sky Chaser on Twitter and Facebook for weather, chasing, and blog updates.
Permalink
03.27.11
Posted in Uncategorized at 8:00 am by Rebekah
Which state do you think has had the most tornado reports so far in 2011?
You might be surprised.
Here’s a map from the Storm Prediction Center showing the location of tornado reports in the U.S. so far, not including the few Georgia tornadoes from yesterday (keep in mind that this is a preliminary map, and not all tornadoes are reported, just as not every report turns out to be a tornado):
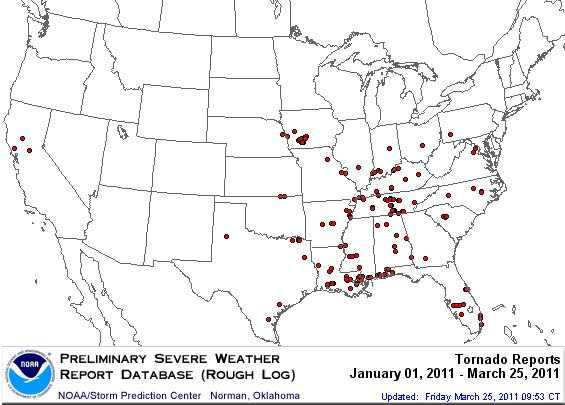
The answer is Louisiana!
Louisiana has had 28 tornado reports. Tennessee came in second, with 23 tornado reports. Alabama and Iowa are tied at third, with 18 tornado reports.
For more state statistics on severe weather reports, check out the Storm Prediction Center’s Annual Report Summary for 2011:
http://www.spc.noaa.gov/climo/online/monthly/2011_annual_summary.html
Follow Green Sky Chaser on Twitter and Facebook for weather, chasing, and blog updates.
Permalink
« Previous entries Next Page » Next Page »


