12.11.12
Posted in Non-US Weather, Weather News at 6:18 pm by Rebekah
This week’s post in the World Wide Weather series features Salzburg, Austria (click for a Yahoo! maps link).
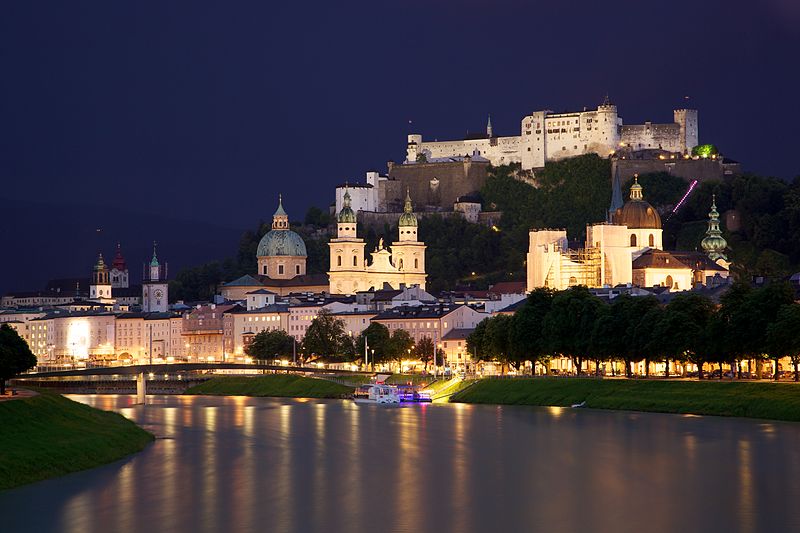
Salzburg Old Town on the Salzach River, photographer Jiuguang Wang, from Wikipedia
Salzburg, on the western border of Austria with Germany, is situated on the northern edge of the Austrian Alps. First settled around the 5th century BC, Salzburg means “Salt Castle”; in the 8th century, barges carrying salt would come down the Salzach River and be subject to a toll.
Today, the city is famous for baroque architecture, the birthplace of Wolfgang Amadeus Mozart, and the stage for the events of “The Sound of Music”. Every summer there is a large festival celebrating classical music and operas.
A few more facts about Salzburg (from Wikipedia):
- Time zone: Central European Time (UTC + 1) or Central European Summer Time (UTC +2)
- Elevation: 1,391 ft (424 m)
- Climate zone: Cool and humid
- Average high temperature: 58 °F (14 °C)
- Average low temperature: 41 °F (5 °C)
- Average annual high/low temperature range: 38 to 76 °F (3 to 24 °C) / 25 to 56 °F (-4 to 14 °C)
- Record high temperature: 100 °F (38 °C)
- Record low temperature: -16 °F (-27 °C)
- Average annual precipitation: 47 inches (1,184 mm)
- Average annual snowfall: 44 inches (113 cm)
Weather: While usually relatively cool due to its location in the foothills of the Alps, Salzburg has a fairly large temperature range throughout the year because of its continental location. Orographic lift (air being forced up the mountains) is responsible for a good amount of rain especially in the summer months, and snow is common in the winter.
Early this week Salzburg is experiencing temperatures below freezing and moderate snowfall. A high pressure system will enter the region later in the week, bringing sunnier skies and milder weather.
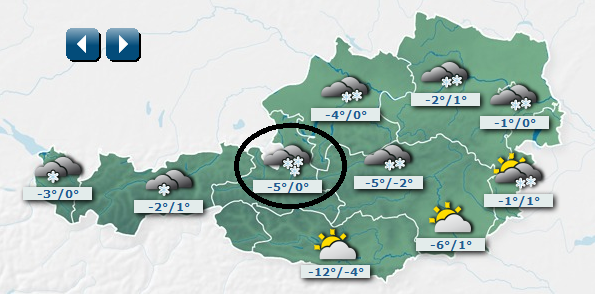
Forecast for Austria for Tuesday morning, temperatures in degrees Celsius. Salzburg is circled. From Austria’s Central Institute for Meteorology and Geodynamics.
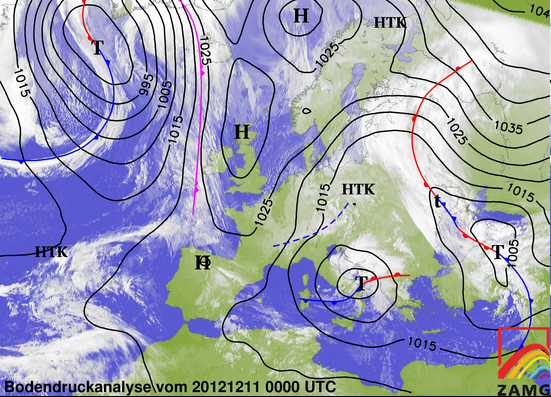
Weather map of Europe, valid 00Z on Tuesday, 11 December, from Austria’s Central Institute for Meteorology and Geodynamics. Note the frontal boundary leaving central Europe, with the high pressure system over the UK soon to pass through.
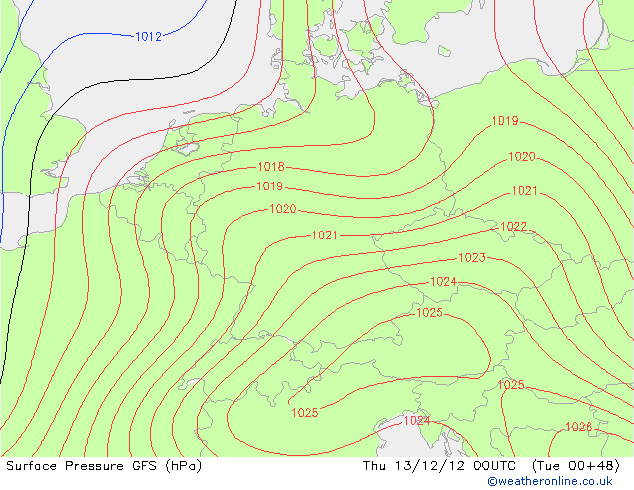
Surface pressure, GFS model, valid at 00Z on Thursday, 13 December, from Weather Online UK. This shows the high pressure system now over Austria, which will bring some breaks in the clouds and precipitation.
For weather maps and information on current and forecast Salzburg weather, check out Austria’s Central Institute for Meteorology and Geodynamics (if your German is as bad as mine, use Google to translate the page), Weather Underground, and Weather Online UK (good for maps and models across the globe). For more information on Salzburg, check out Wikipedia.
Permalink
12.06.12
Posted in Non-US Weather, Weather News at 7:11 pm by Rebekah
Two tornadoes struck the northern side of the North Island of New Zealand today, sadly killing three people in the Auckland suburb of Hobsonville and leaving many others homeless.
Check out these news articles for details, photos, and videos:
That last link is a video someone took out their window as the tornado passed–definitely not the safest thing to do! If a tornado is moving through your neighborhood, you should find shelter, if not underground then in a small interior room. Above all else stay away from windows; fortunately the videographer did not appear to have sustained any injuries.
On the other side of the world, a beautiful waterspout touched down off the northwestern coast of Italy.
This waterspout reminded me of a recent Italian tornado (The Weather Channel video link) and waterspout earlier this week (YouTube link) as well as amazing video of an Australian waterspout last month (Facebook link).
Update: The New Zealand tornado event has since been surveyed and determined to more likely have been a microburst. A MetService blog about the event may be found here: Hobsonville wind storm Thursday 6 December 2012.
Permalink
12.04.12
Posted in Non-US Weather, Tropical Weather, Weather News at 4:52 pm by Rebekah
Yesterday I posted about Typhoon Bopha and its proximity to the equator. Bopha went on to strengthen to the equivalent of a Category 5 on the Saffir-Simpson Scale, and made landfall in the Southern Philippines as a Super Typhoon with maximum sustained winds of 160 mph.
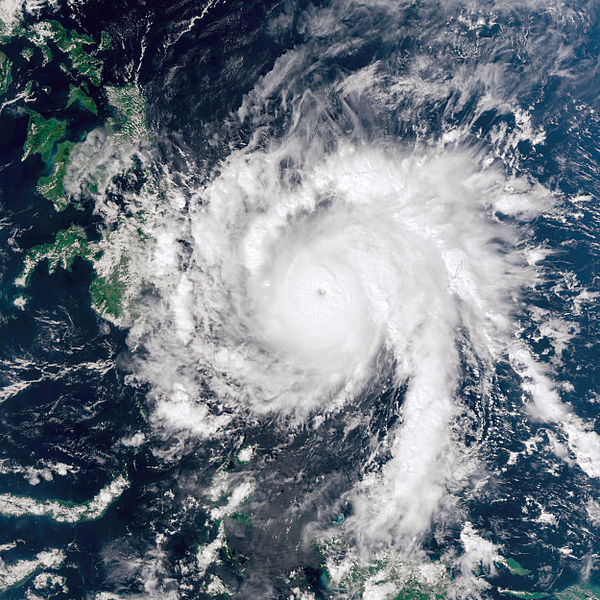
NASA image of Super Typhoon Bopha just prior to landfall in the Philippines. From Wikipedia.
To quote again from an article on The Weather Channel’s website:
“Dating to 1945, there have been only 4 other typhoons that have tracked within 200 nautical miles of Davao, Philippines (on Mindanao Island) with an intensity of at least a category-four storm, including Mike (“Ruping”) above:
- Mike “Ruping” (1990)
- Ike “Nitang” (1984)
- Kate “Titang” (1970)
- Louise:Marge “Ining” (1964)
Only “Ruping” and “Ining” were the equivalent of category-five storms.”
Furthermore, the article cites Dr. Jeff Masters of Weather Underground saying Bopha formed closer to the equator (at 3.8°N) than any other tropical cyclone on record, and nearly became the closest to the equator Category 5 storm (at 7.4°N). Only Super Typhoon Louise in 1964 was closer at Category 5 strength, at 7.3°N.
Permalink
12.03.12
Posted in Non-US Weather, Tropical Weather, Weather Education, Weather News at 5:09 pm by Rebekah
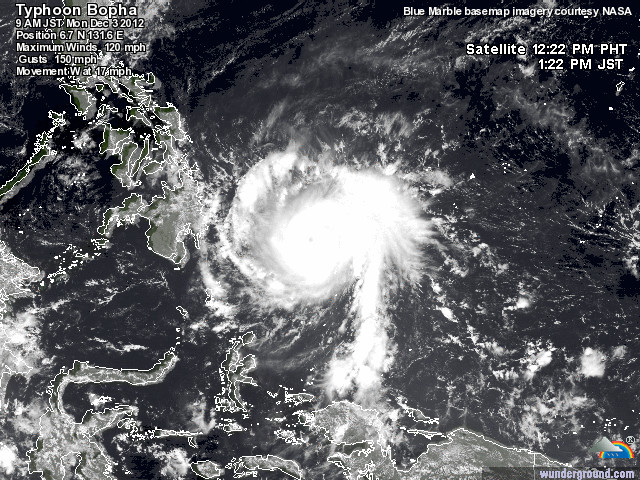
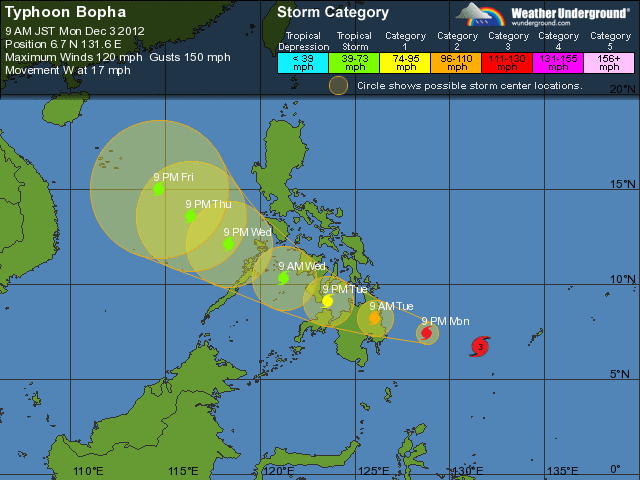
Typhoon Bopha narrowly missed Palau last night on its westward track through the west central Pacific. The typhoon has weakened slightly from the equivalent of a Category 4 on the Saffir-Simpson Scale to a Category 3 as it makes its way towards the southern Philippines.
It is unusual for a strong typhoon to exist so close to the equator; a recent article from The Weather Channel points out that Bopha is the strongest typhoon to track through the southern Philippines in 22 years.
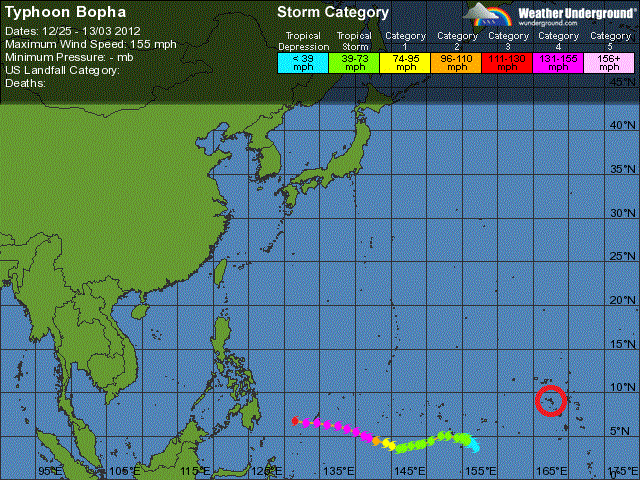
Bopha’s history (above) and 5-day forecast (below); Kwajalein Atoll (where I live) is circled in red. All images courtesy of Weather Underground.
But why is this unusual? Put simply, tropical cyclones require a certain amount of rotation to be able to strengthen. You probably know that wind in the Northern Hemisphere is deflected one way, while wind in the Southern Hemisphere is deflected the other way–this is known as the Coriolis force.
The closer you are to the poles, the stronger the deflection; which means the closer you are to the equator, the less the wind favors deflecting one way or the other. Even if you have all the other necessary “ingredients” for a tropical cyclone to form, if the trough of low pressure does not start to rotate, or does not rotate very much, the central pressure will fail to deepen and the wind speeds will not increase very much (remember, the stronger the pressure gradient, the stronger the winds as the atmosphere tries to balance out the pressure differences — see Meteorology 101: Elements of Weather – Wind).
Generally you will not see tropical cyclones forming between about 5°N and 5°S, let alone strengthening to Category 4 storms. This is why here at Kwajalein, at 8°N, we don’t expect we could get much more than the equivalent of a Category 2. Many tropical cyclones form near the Marshall Islands, but in order to get a stronger storm tracking through, it would need to form further upstream and closer to the equator, which is possible but not very common.
See also one of my previous posts on how tropical cyclones form: Tropical Cyclones: How They Form, Move, and Strengthen (aka, What Danielle, Earl, and Frank Are Up To) – Part 1
Permalink
12.02.12
Posted in Non-US Weather, Tropical Weather, Weather News at 5:16 pm by Rebekah
Here on an island with dial-up Internet at home and no cell phone service it can be hard to feel connected with the rest of the world sometimes.
However, even in an area with some of the least interesting (but perhaps most pleasant) weather in the world, you can still find global atmospheric connections.
Yesterday Kwajalein received 4.17 inches of rain. That’s not too unusual, but it’s still a pretty rainy day. The Christmas tree lightning and ceremony had to be postponed for a couple of days.
Meanwhile, my parents in the Pacific Northwest tell me that parts of the West Coast have been receiving good amounts of rain and snow due to “atmospheric rivers”. A while back I wrote a post on rivers of moisture, specifically the Pineapple Express (transporting atmospheric moisture from the tropical Pacific to the West Coast of the US) and the Rum Runner (tropical Atlantic to the UK and western Europe).
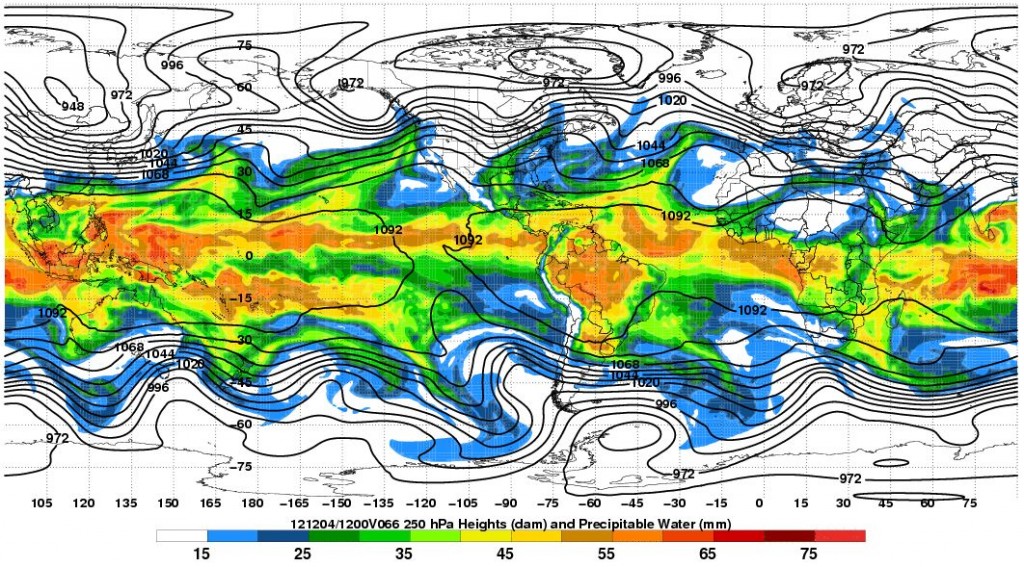
The following map (click to enlarge; from this precipitable water loop) shows the next moisture plume headed for the West Coast (green to yellow shading), and as you can see, most of that moisture can be traced back to Hawaii and points southwest of there. Kwajalein lies at about 8N, 167E, which on this map is in the middle of an orange band of juicy atmospheric moisture. Most of our moisture comes from the east and goes towards the west as we’re in the tropics, but it’s kind of cool for me to think that the moisture from all of our rain yesterday had pretty much the same source as the moisture headed towards my family.
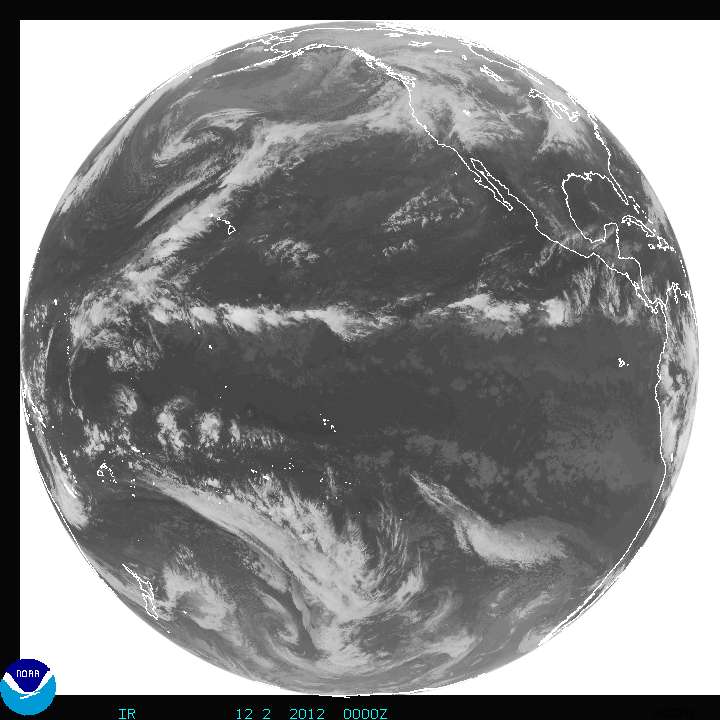
This MTSAT infrared satellite image shows the picture in a different way, with a band of clouds marching westward through the tropics and a band of clouds streaming northeastward from the tropics through Hawaii and on to the West Coast. This is one of many conveyor belts through the atmosphere that works to balance out an aspect of weather, in this case transferring warm, moist air from the tropics towards the poles!
Permalink
« Previous entries Next Page » Next Page »


