03.28.11
Meteorology 101: Lightning Detection Networks
Last week in the weather education series we looked at weather satellites. This week we’ll wrap up meteorological measurements with lightning detection networks.
This discussion will be limited to two lightning detection networks: the U.S. National Lightning Detection Network (NLDN) and the 3D Lightning Mapping Array (LMA).
National Lightning Detection Network
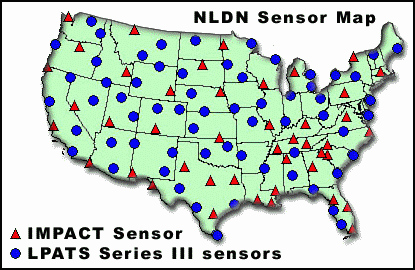
The NLDN, established in 1989, is a network of over 100 sensors spread across the United States (there is also a similar lightning detection network in Canada, and together the networks are called the North American Lightning Detection Network).
Put simply, the sensors detect electromagnetic radiation from lightning ground strikes (cloud-to-ground, or CG flashes). The time of the strike, strike location, current magnitude (i.e., strength of the strike), current polarity (e.g., positive or negative), and number of return strokes is recorded for each observed CG flash. The strike location is determined by triangulation.
Map of the NLDN sensors. There are two types of sensors indicated on the map.
3D Lightning Mapping Array
There are currently three 3D lightning mapping arrays (LMAs) in operation in the U.S., all set up under the direction of New Mexico Tech. The LMAs are located in New Mexico, central Oklahoma, and northern Alabama.
My work in the lightning research department at the University of Oklahoma has dealt extensively with the Oklahoma LMA, run by a group in the National Severe Storms Laboratory.
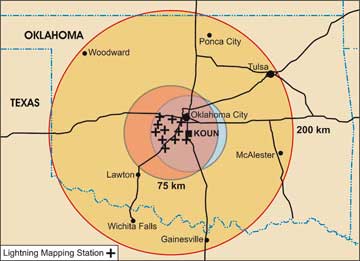
The OK-LMA consists of 11 stations in west central Oklahoma, each of which is equipped with a very high frequency (VHF) antenna, to detect the radiation produced by the lightning, and a time-of-arrival sensor, to determine time and location information about the VHF radiation points from both intracloud (IC) and CG lightning flashes.
We can then use this VHF data for various purposes, such as finding out where and when the lightning flash initiated. This was a large part of my research for my M.S. degree.
The plus symbols show the location of each LMA station in Oklahoma, the orange circle shows the range of the 3D LMA, and the yellow circle shows the range of the LMA for just 2D data (the inner, pinkish to blue circle is the range of the polarimetric radar KOUN).
————————————————–
Next Monday we will move on to weather maps!
Follow Green Sky Chaser on Twitter and Facebook for weather, chasing, and blog updates.

